Tuesday, 25 June 2013

Wave patterns on longer term views

EUR/USD

Our mid-term expectations haven’t changed much – it looks like Euro is completing the second part of zigzag (E) of [B], a descending wave C of (E) of [B], which may take the form of an impulse.
EURUSD
We may assume that the price is forming a descending wave C of (E) in the form of an impulse with a predicted target at 1.2759 or lower.
EURUSD
We may assume that a descending wave C is taking the form of an impulse. If this assumption is correct, the pair will continue falling down without breaking the critical level.
EURUSD

GBP/USD

Our mid-term expectations remain the same – it looks like Pound is finishing the second part of zigzag Y of (D), wave [c] of Y of (D), which may take the form of an impulse.
GBPUSD
We may assume that the price is forming a descending wave [c] of Y of (D) in the form of an impulse with a predicted target below 1.50.
GBPUSD
We may assume that Pound is forming a descending wave [c] of Y. If this assumption is correct, the pair will continue falling down without breaking the critical level.
GBPUSD

USD/CHF

We can’t exclude a possibility that Franc completed a possible descending correction [b] of C of (4) in the form of extended flat. This assumption has yet to be confirmed, but if it is correct, then later the price is expected to start a new ascending trend inside wave [c] of C of (4).
USDCHF
We can’t exclude a possibility that Franc started forming an ascending wave [c] of C. However, right now it’s not quite clear which form it will take, an impulse or diagonal triangle.
USDCHF
We can’t exclude a possibility that Franc is forming an ascending wave [c]. This assumption has yet to be confirmed, but we should note that the structure of this wave may be changed.
USDCHF

USD/JPY

After completing a possible ascending wedge (A) of [4], the price is expected to form a descending correction (B) of [4], the form of which isn’t quite clear yet.
USDJPY
We can’t exclude a possibility that a descending correction (B) started with wedge [a] of A of (B) and right now the price is forming an ascending correction [b] of A of (B). If this assumption is correct, then later the price may finish an ascending correction [b] of A of (B) and continue falling down to complete wave A of (B).
USDJPY
We may assume that the pair is forming an ascending zigzag [b] and completing its descending correction (b) of [b]. Later the price is expected to continue moving upwards.
USDJPY

Tuesday, 11 June 2013

Market Update

EUR/USD Current price: 1.3311

View Live Chart for the EUR/USD
e
The EUR/USD trades above 1.3300 finally, with a slow but steady advance in the US session, and having been pretty wild over the last few hours, coming and going in a 100 pips range on headlines. Again yen gains lead dollar losses, as further position unwinding is seen in JPY crosses. The EUR/USD however remains limited on speculation a rate cut is quite firm on ECB table, although maintains the bullish stance according to technical readings: the hourly chart shows price firming up above 20 SMA, as indicators head north in positive territory. In the 4 hours chart technical stance is just the same, with scope now for an advance towards 1.3360 in the short term.

Support levels: 1.3290 1.3245 1.3200

Resistance levels: 1.3325 1.3360 1.3400

EUR/JPY Current price: 127.68

View Live Chart for the EUR/JPY (select the currency)
ey
The EUR/JPY lost most of the ground recovered in the past to day, again nearing key dynamic support, its 100 DMA today around 126.30. As for the hourly chart, indicators head south in deep red after having barely corrected extreme oversold readings, while moving averages gain bearish slope well above current price. Bigger time frames show technical readings also favoring a downward continuation, with 127.10 as immediate support to break to confirm a test of the mentioned 100 DMA.

Support levels: 127.10 126.30 125.50

Resistance levels: 128.40 129.00 129.60

GBP/USD Current price: 1.5646

View Live Chart for the GBP/USD (select the currency)
g
The GBP/USD was also benefited by yen momentum, recovering up to 1.5652, so far the daily high. While technical readings lack a strong upward momentum, the dominant trend is bullish, and there’s little to do about it, but buy on dips. The hourly chart shows 20 SMA gaining a bullish slope and indicators in positive territory, which supports more gains despite the lack of strength. In the 4 hours chart the technical outlook is also bullish, supporting the shorter term view and a test of the weekly target of 1.5770.

Support levels: 1.5610 1.5550 1.5500

Resistance levels: 1.5650 1.5690 1.5730

USD/JPY Current price: 96.04

View Live Chart for the USD/JPY (select the currency)
Y
Yen again advanced for most of the day after the BOJ disappointed: the USD/JPY reached an intraday low of 95.58, breaking below 100 DMA, and about to close the day below it, first time since mid October 2011. Despite trading around 50 pips higher, the technical picture continues to be strongly bearish, with indicators heading south in oversold territory, and moving averages gaining even more downward slope above current price. Having a hard time to hold above the 96.00 level so far, a break below mentioned low should lead to a test of 95.00 area while once below this last, 93.60, 38.2% retracement of these months bullish run, comes at sight.

Support levels: 95.45 95.10 94.70

Resistance levels: 96.20 96.50 96.90

AUD/USD: Current price: 0.9437

View Live Chart for the AUD/USD (select the currency)
a
Even AUD got benefited for dollar fall, as despite the slide in stocks and commodities, the pair managed to recover some ground, trading back above the 0.9400 mark. Short term bullish according to the hourly chart, the pair may extend its advance towards 0.9570/0.9500 area, where next hurdle of sellers awaits. Renewed selling pressure leading to a fall below 0.9380 support, will deny the chance of an upward correction and favor a retest of recent lows.

Support levels: 0.9410 0.9380 0.9320

Sunday, 2 June 2013

AUD/USD Oversold?

Aud/Usd is certainly oversold on all indicators.

Our Swing Trading software is confirming a buy...


In this chart we can see a White star, major support and reversal indicator.

Along with divergence on the CCI and MACD.

The trigger of the WA Explosion confirms a BUY NOW.

Thursday, 30 May 2013

Oil is almost ready so is EUR/CHF, USD/CHF, EUR/USD....Get ready!

EUR/CHF Swing Trade confirms divergence:


 In this chart example we can see the trend, BLUE ABOVE RED.

Divergence on the 4 hour, Stochastic oversold.......

We need to get closer to the action...

Early Warning system confirms a trade..


The above chart shows the White star, divergence and now we have a golden cross..Look to BUY

OIL

Major support at 9200, if broken opens up 9000, however if price holds above 9200 Look to BUY..

The above chart confirm support with a yellow star, in an uptrend.

Notice divergence as well and OVERSOLD Stochastic

Early Warning System

The above chart goes closer to the market, White star, divergence.

We now await the Blue line to Cross the red for a BUY.

Friday, 24 May 2013

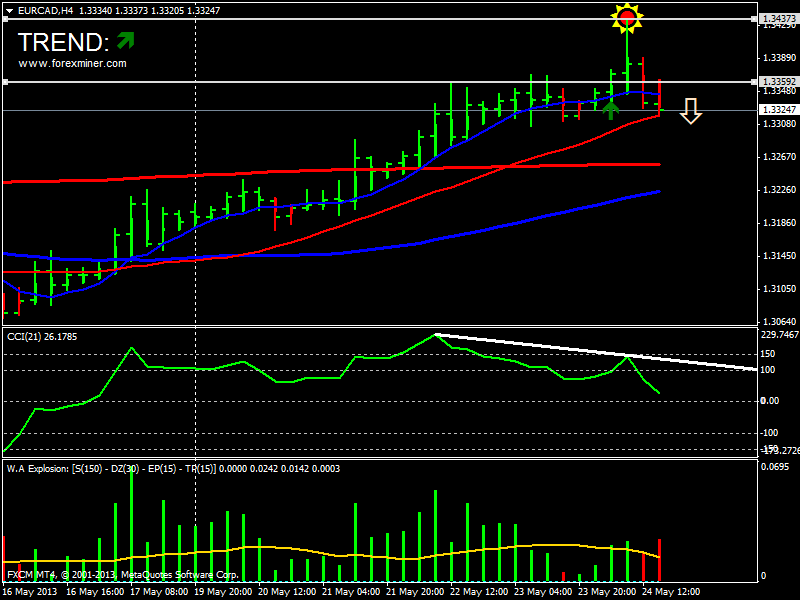
EURCAD is ready but....


In this chart we can see we have confirmation of a sell..with the trend....

Yellow star an excellent divergence tool.

CCI has divergence.

WA Explosion confirms red bar above the yellow line.

Looking for price to pull back to 13350, with 100 pip stop.

Tuesday, 21 May 2013

TECHNICALS ON MAJORS

Technical Analysis

EUR/USD
EURUSD
EUR/USD is traded at weekly PP
“It’s the U.S. economy that’s in the vanguard, and that explains why the dollar continues to advance. The Federal Reserve might exit its quantitative easing sooner than later, while the BoE is going to do more QE and the ECB is favored to do more.”
- Miller Tabak & Co. (based on CNBC)
  • Pair’s Outlook
    The common European currency recovers, as the price breached the monthly S1 level at 1.2875 and weekly pivot point at 1.2885 yesterday. Seems that Dollar’s appreciation takes a break and the pair undergoes a small correction. Considering its possible extent, it is likely to see an attempt to overcome an intersection point of the 55-day SMA and weekly R1 at 1.2974. Possible target for our long position. However, a trend of the market depends on the FOMC decision regarding the monetary easing programme.
  • Traders’ Sentiment
    Euro-bears enlarged their share by another 2% to 54%. It seems that investors foresee a stronger Dollar again, as the U.S. economy improves. Pending orders market is gently bearish with 54% of sell orders.
GBP/USD
GBPUSD
GBP/USD gains above weekly PP
“There’s a bit of position squaring after the run we have seen and ahead of Bernanke this week, but the dollar remains a buy on dips. The Bank of England revised their growth outlook last week but it’s hardly the stuff of legends.”
- HSBC Holding Plc. (based on Reuters)
  • Pair’s Outlook
    GBP/USD strengthened yesterday, as the exchange rate increased from the monthly S1 at 1.5191 to the weekly pivot point at 1.5340. The pair was pushed higher amid better-than-expected home sales data, indicating that the domestic economy might be really recovering. In case bullish sentiments persist this week, it is likely to see the price around a 1.5322 level, where the 55-day, 100-day SMAs merge with the weekly R1 level.
  • Traders’ Sentiment
    Bullish share in SWFX market contracted by 5% to 55%, meaning that currently there are a lot of speculators, who are ready to profit from very small corrections. Placed orders segment is neutral, since both sides have exactly the same amounts.
USD/JPY
USDJPY
USD/JPY remains unchanged
“The yen has weakened in part because Amari tried to downplay his remarks. Amari’s comment hasn’t shown any clear change, but it’s milder in terms of slowing yen weakness.”
- Aozora Bank Ltd. (based on Bloomberg)
  • Pair’s Outlook
    USD/JPY pair is in the middle of a battle between bulls and bears, since the price has been trading flat past two weeks. The pair fluctuates between 103 and 102 levels around the weekly pivot point at 102.43. A bullish trend should succeed, as some bank analysts deliver bullish signals for the rest of a year. On the other hand, traders say that the pair is overbought now (hence our short position), as the major indicators deliver warning signals. Mostly due to that the pair is moving sideways in recent sessions.
  • Traders’ Sentiment
    SWFX marketplace investors shift towards bullish sentiments, as the buy side increased by another 7%, compared with the data last morning, to a 73% share. Waiting orders market is also bullish with 67% of buy orders.
USD/CHF
USDCHF
USD/CHF hovers near monthly R2
“Markets remain jittery about the potential for the tapering of asset purchases ahead of Chairman Bernanke's testimony to Congress.”
- Barclays Plc. (based on Reuters)
  • Pair’s Outlook
    USD/CHF has already dropped 100 pips from a Friday’s peak, when it reached a 0.9761 level. Currently the pair is traded at 0.9663, where the monthly R2 and weekly PP are located. Further movement directly depends on the sentiments regarding the U.S. Dollar. If investors continue to buy assets denominated in the U.S. currency, USD/CHF should proceed its up-move while facing the resistance at 0.9799, where the monthly R3, weekly R1 and Bollinger band coincide.
  • Traders’ Sentiment
    Investors keep their strong bearish sentiments, as the sell side has 71% of all opened orders in the market. Pending orders segment is slightly bullish, since 58% of waiting orders are to buy the buck.

Friday, 17 May 2013

GBP/CHF lets try again....

GBP/CHF  shows signs of a reversal here:


Divergence on the MACD, Divergence on the CCI, white star.

Head and Shoulders chart pattern..

Sell now