Monday, 8 July 2013
FX Market Update, short term
EURUSD
The Euro fell further on Friday and ended week just above strong support at 1.2795, 17/05 low, losing 1.78% for the week. Negative tone keeps the price pressured for full retracement of 1.2795/1.3414 upleg, as the price broke below bull-trendline, connecting 1.2744/1.2795 lows. Scope is seen for eventual push lower for test of 1.2744/50 double-bottom and completion of bull phase the commenced from these levels. Brief consolidation above Friday’s fresh low is triggered by oversold conditions, with any stronger rally, expected to find strong barrier at 1.2955, 50% retracement of 1.3102/1.2805 downleg / daily Ichimoku cloud base.
Res: 1.2870; 1.2920; 1.2955; 1.2989
Sup: 1.2805; 1.2795; 1.2750; 1.2700
GBPUSD
Cable remains under increased pressure, with fresh weakness, seen last Friday, losing 23/29 / 05 double-bottom and psychological support at 1.5000 and accelerating losses below 1.4900 handle, to post fresh 4-month low at 1.4856. After completing 1.5000/1.5751 upleg, the pair is looking for test of another important support at 1.4830, 12/03 low / near 61.8% retracement of longer-term 1.3501/1.7041 ascend, to fully reverse larger bull phase. With bears dominating on larger and lower timeframes studies, further weakness is seen favored, with bears to be interrupted by limited corrective rallies on oversold short-term conditions. Former lower platform and 50% retracement of 1.5303/1.4856 downleg at 1.5080, offers solid resistance and is expected to cap.
Res: 1.4915; 1.4960; 1.5000; 1.5026
Sup: 1.4856; 1.4830; 1.4800; 1.4780
USDJPY
The pair rallied strongly on Friday, with acceleration higher started from higher base at 100.00 and completed 100.84/99.25 corrective phase. Break and weekly close above 101.00 barrier, suggests further appreciation, with initial targets standing at 101.79, 30/05 high and psychological 102.00 barrier. Extension above the latter is expected to open May’s lower platform at 102.50. Prevailing positive tone on short-term studies, supports the notion, with corrective pullback on overbought conditions, expected to precede fresh rallies. Good support lies at 100.40 zone, 50% of 99.25/101.52 upleg / 05/07 high and is seen as ideal reversal point.
Res: 101.52; 101.79; 102.00; 102.56
Sup: 100.84; 100.65; 100.40; 100.00
AUDUSD
The Aussie dollar came under pressure and ended the week in red, after recovery rally stalled at 0.9179 and fresh bearish acceleration left a double-top. Quick reversal nearly fully retraced 0.9035/0.9179, short-term corrective phase. Bears look for break below 0.9035, 03/07 low that guards psychological 0.9000 support and 0.8959, Fibonacci 100% expansion of the downwave that commenced from 1.0581. Bearish 20/55 DMA’s crossover at 0.9115, maintains bears, while only rally above 0.9179 barrier would delay bears.

Thursday, 4 July 2013
Eur/Usd is it ready?
EUR/USD
fell for a second week in a row as the euro surrendered to a
strengthening dollar and speculation that the ECB might act. Will Draghi
send the euro even lower? Manufacturing and services PMI’s, Inflation
data, and the ECB’s rate decision are the highlights of this week. Here
is an outlook on the main events ahead and an updated technical analysis
for EUR/USD.
Draghi reiterated ,in a speech in Paris, that the ECB’s monetary policy would remain accommodative and that the bank is ready to act in order to bail out the European economy from its long lasting recession. The measures include facilitating excessive labor market regulations which led to an increase in youth unemployment. In the US, the downgrade of growth figures for Q1 and the effort of Fed officials to downplay tapering expectations did little to curb the dollar’s strength. As long as the economy keeps growing, tapering plans remain in place and this is certainly dollar supportive.
Updates:
- Manufacturing PMIs from Spain, Italy and the Eurozone all showed improvement and beat their estimates.
- Italian Monthly Unemployment Rate edged higher, from 12.1% to 12.2%.
- Eurozone CPI Flash Estimate gained 1.6%, matching the forecast.
- Eurozone Unemployment Rate improved, dropping to 12.1% from 12.3%.
- Spanish Unemployment Change dropped sharply by 127.2 thousand, well below the forecast of -83.5 thousand. However, this could be a seasonal drop.
- Eurozone PPI declined 0.3%, missing the estimate of -0.2%.
- Euro Services PMIs will be released on Wednesday.
- EUR/USD is losing ground as the pairs tests the 1.30 line.
- EUR/USD makes a convincing fall below 1.30 on the crisis in Portugal: the government in Portugal is very unstable after a streak of resignations. The bailout program is in danger at bad timing for the continent.
- EUR/USD managed to recover and climb above 1.2960. Better than expected job gains in the US didn’t stop the recovery. It trades at around 1.2980. 1.30 provides resistance.
- Manufacturing PMIs: Monday. The Manufacturing sectors in Spain, Italy and the Euro-zone moved closer to stabilization in May, although the readings were still below the 50 point line, indicating contraction. Spanish manufacturing activity shrank at a slower pace, reaching 48.1 in May from 44.7 in April. New orders edged up to 49.5 from 43 in April, however domestic demand remained sluggish. Italian Manufacturing PMI increased to 47.3 in May from 45.50 in April, beating market forecast of a 46.20 reading. The Euro-zone Manufacturing Purchasing Managers’ Index also edged up to 48.3 from April’s 46.7, higher than the 47.8 estimated. Overall, contraction in the EU area slowed down considerably in May giving hope for a modest recovery in the coming months. Spanish manufacturing sector is expected to climb to 48.9, Italy to 47.3 and the Euro-zone is expected to reach 48.7.
- Italian Monthly Unemployment Rate: Monday, 8:00. Italian unemployment remained above 10% for the 15th month in April, reaching 12%, worse than the 11.6 estimated by analysts. Italy’s new prime minister Enrico Letta, promised lawmakers that employment will be the “top priority” of his government. Another increase to 12.1% is expected now.
- CPI Flash Estimate: Monday, 9:00. The annual inflation in the Euro-zone increased from 1.2 % to 1.4 % in May, in line with Eurostat’s flash estimate released two weeks earlier. For the 27-member European Union, which includes the euro-zone, annual inflation is at 1.6%, while month-to-month prices increased 0.1%. A rise to 1.6% is anticipated.
- Unemployment Rate: Monday, 9:00. Almost one in four is out of work in the 17 member states comprising the Eurozone. Unemployment rose to 12.2% in April, following 12.1% in March. Many blame the harsh austerity measures imposed by the ECB. Economists forecast further worsening before any improvement in the labor market. A further increase to 12.3% is expected this time.
- Spanish Unemployment Change: Tuesday, 7:00. Spanish unemployment is on a recovery path following May’s fantastic drop in the number of unemployed down of 98,265 from April. Hiring was stronger due to the coming summer holiday season. Another improvement is expected with a reduction of 83,500 unemployed.
- PPI : Tuesday, 9:00. Euro zone producer prices continued to decline in April contracting 0.6% after a 0.2% drop in the previous month. The fall was worse than expected. In a yearly base, PPI showed a 0.2% fall in April, after a 0.6% gain in the previous month. A smaller drop of 0.2% is expected.
- Services PMIs: Wednesday. Mixed readings were released in May about the service sectors in Spain, Italy and the Euro-zone. Spain’s services sector increased to 47.3 from 44.4 in April, the slowest contraction since mid-2011, indicating Spain may finally step out of recession on its way to recovery. However Italy’s service sector continued to decline in May at a faster pace than in April falling to 46.5 from 47.0 in in the previous month and the Euro area service sector contracted to 47.2 from 47.5 in April, lower than the 47.5 estimated. Spain is expected to improve to 47.8, Italy to 47.1 and the Euro-Zone to 48.6.
- Retail Sales: Wednesday, 9:00. Retail sales in the 17 countries that use the euro fell more-than-expected in April, declining for the third consecutive month, dropping 0.5% after a 0.2% fall in March. The decline was worse than the 0.2% drop projected by analysts. On a yearly base, retail sales dropped 1.1% in April from a year earlier, below expectations for a 0.8% decline, after falling 2.2% in March. A gain of 0.4% is anticipated.
- Final GDP: Thursday, 9:00. The euro zone’s economic contraction slowed in the first three months of 2013, falling 0.2% after a 0.6% contraction in the last quarter of 2012. The reading was in line with market predictions. Overall, the Euro-zone remains weak despite encouraging signs suggesting recession halts in the Euro-zone. Consumers are still weak with limited purchasing power making recovery even harder. This will likely be confirmed now.
- Rate decision: Thursday, 11:45, press conference at 12:30. The ECB isn’t expected to announce any change in policy in the upcoming meeting. In the previous one, it seemed that Draghi put the idea of a negative deposit rate on the backburner. However, the situation in the financial markets has dramatically changed since then: bond yields have risen and could bring the debt crisis back to the limelight. In the past, Draghi zigzagged between different moods between various meetings. After a positive and confident appearance last month, he could warn about the rising bond yields, growth prospects and falling inflation, given an impression that negative rates are more relevant once again and that the OMT is ready to be used soon. A worried Draghi could send the euro lower, while another confident appearance could help it.
- German Factory Orders: Friday, 10:00. German factory orders plunged in April down 2.3% offsetting last month’s gain indicating Germany continues to struggle with recession in the Euro-zone. Economists expected a 1% drop. Nevertheless, German business confidence increased in May for the first time since February, indicating Germany is expected to grow in the coming months. Factory orders are expected to advance by 1.3% this time.
Tuesday, 25 June 2013
Wave patterns on longer term views
EUR/USD
Our mid-term expectations haven’t changed much – it looks like Euro is completing the second part of zigzag (E) of [B], a descending wave C of (E) of [B], which may take the form of an impulse.
We may assume that the price is forming a descending wave C of (E) in the form of an impulse with a predicted target at 1.2759 or lower.

We may assume that a descending wave C is taking the form of an impulse. If this assumption is correct, the pair will continue falling down without breaking the critical level.

GBP/USD
Our mid-term expectations remain the same – it looks like Pound is finishing the second part of zigzag Y of (D), wave [c] of Y of (D), which may take the form of an impulse.
We may assume that the price is forming a descending wave [c] of Y of (D) in the form of an impulse with a predicted target below 1.50.

We may assume that Pound is forming a descending wave [c] of Y. If this assumption is correct, the pair will continue falling down without breaking the critical level.

USD/CHF
We can’t exclude a possibility that Franc completed a possible descending correction [b] of C of (4) in the form of extended flat. This assumption has yet to be confirmed, but if it is correct, then later the price is expected to start a new ascending trend inside wave [c] of C of (4).
We can’t exclude a possibility that Franc started forming an ascending wave [c] of C. However, right now it’s not quite clear which form it will take, an impulse or diagonal triangle.

We can’t exclude a possibility that Franc is forming an ascending wave [c]. This assumption has yet to be confirmed, but we should note that the structure of this wave may be changed.

USD/JPY
After completing a possible ascending wedge (A) of [4], the price is expected to form a descending correction (B) of [4], the form of which isn’t quite clear yet.
We can’t exclude a possibility that a descending correction (B) started with wedge [a] of A of (B) and right now the price is forming an ascending correction [b] of A of (B). If this assumption is correct, then later the price may finish an ascending correction [b] of A of (B) and continue falling down to complete wave A of (B).

We may assume that the pair is forming an ascending zigzag [b] and completing its descending correction (b) of [b]. Later the price is expected to continue moving upwards.

Tuesday, 11 June 2013
Market Update
EUR/USD Current price: 1.3311
View Live Chart for the EUR/USD
The EUR/USD trades above 1.3300 finally, with a slow but steady advance in the US session, and having been pretty wild over the last few hours, coming and going in a 100 pips range on headlines. Again yen gains lead dollar losses, as further position unwinding is seen in JPY crosses. The EUR/USD however remains limited on speculation a rate cut is quite firm on ECB table, although maintains the bullish stance according to technical readings: the hourly chart shows price firming up above 20 SMA, as indicators head north in positive territory. In the 4 hours chart technical stance is just the same, with scope now for an advance towards 1.3360 in the short term.
Support levels: 1.3290 1.3245 1.3200
Resistance levels: 1.3325 1.3360 1.3400
EUR/JPY Current price: 127.68
View Live Chart for the EUR/JPY (select the currency)
The EUR/JPY lost most of the ground recovered in the past to day, again nearing key dynamic support, its 100 DMA today around 126.30. As for the hourly chart, indicators head south in deep red after having barely corrected extreme oversold readings, while moving averages gain bearish slope well above current price. Bigger time frames show technical readings also favoring a downward continuation, with 127.10 as immediate support to break to confirm a test of the mentioned 100 DMA.
Support levels: 127.10 126.30 125.50
Resistance levels: 128.40 129.00 129.60
GBP/USD Current price: 1.5646
View Live Chart for the GBP/USD (select the currency)
The GBP/USD was also benefited by yen momentum, recovering up to 1.5652, so far the daily high. While technical readings lack a strong upward momentum, the dominant trend is bullish, and there’s little to do about it, but buy on dips. The hourly chart shows 20 SMA gaining a bullish slope and indicators in positive territory, which supports more gains despite the lack of strength. In the 4 hours chart the technical outlook is also bullish, supporting the shorter term view and a test of the weekly target of 1.5770.
Support levels: 1.5610 1.5550 1.5500
Resistance levels: 1.5650 1.5690 1.5730
USD/JPY Current price: 96.04
View Live Chart for the USD/JPY (select the currency)
Yen again advanced for most of the day after the BOJ disappointed: the USD/JPY reached an intraday low of 95.58, breaking below 100 DMA, and about to close the day below it, first time since mid October 2011. Despite trading around 50 pips higher, the technical picture continues to be strongly bearish, with indicators heading south in oversold territory, and moving averages gaining even more downward slope above current price. Having a hard time to hold above the 96.00 level so far, a break below mentioned low should lead to a test of 95.00 area while once below this last, 93.60, 38.2% retracement of these months bullish run, comes at sight.
Support levels: 95.45 95.10 94.70
Resistance levels: 96.20 96.50 96.90
AUD/USD: Current price: 0.9437
View Live Chart for the AUD/USD (select the currency)
Even AUD got benefited for dollar fall, as despite the slide in stocks and commodities, the pair managed to recover some ground, trading back above the 0.9400 mark. Short term bullish according to the hourly chart, the pair may extend its advance towards 0.9570/0.9500 area, where next hurdle of sellers awaits. Renewed selling pressure leading to a fall below 0.9380 support, will deny the chance of an upward correction and favor a retest of recent lows.
Support levels: 0.9410 0.9380 0.9320
Sunday, 2 June 2013
AUD/USD Oversold?
Aud/Usd is certainly oversold on all indicators.
Our Swing Trading software is confirming a buy...

In this chart we can see a White star, major support and reversal indicator.
Along with divergence on the CCI and MACD.
The trigger of the WA Explosion confirms a BUY NOW.
Our Swing Trading software is confirming a buy...
In this chart we can see a White star, major support and reversal indicator.
Along with divergence on the CCI and MACD.
The trigger of the WA Explosion confirms a BUY NOW.
Thursday, 30 May 2013
Oil is almost ready so is EUR/CHF, USD/CHF, EUR/USD....Get ready!
EUR/CHF Swing Trade confirms divergence:
 In this chart example we can see the trend, BLUE ABOVE RED.
Divergence on the 4 hour, Stochastic oversold.......
We need to get closer to the action...
Early Warning system confirms a trade..

The above chart shows the White star, divergence and now we have a golden cross..Look to BUY
OIL
Major support at 9200, if broken opens up 9000, however if price holds above 9200 Look to BUY..
 The above chart confirm support with a yellow star, in an uptrend.
Notice divergence as well and OVERSOLD Stochastic
Early Warning System
 The above chart goes closer to the market, White star, divergence.
We now await the Blue line to Cross the red for a BUY.
Divergence on the 4 hour, Stochastic oversold.......
We need to get closer to the action...
Early Warning system confirms a trade..
The above chart shows the White star, divergence and now we have a golden cross..Look to BUY
OIL
Major support at 9200, if broken opens up 9000, however if price holds above 9200 Look to BUY..
Notice divergence as well and OVERSOLD Stochastic
Early Warning System
We now await the Blue line to Cross the red for a BUY.
Friday, 24 May 2013
EURCAD is ready but....
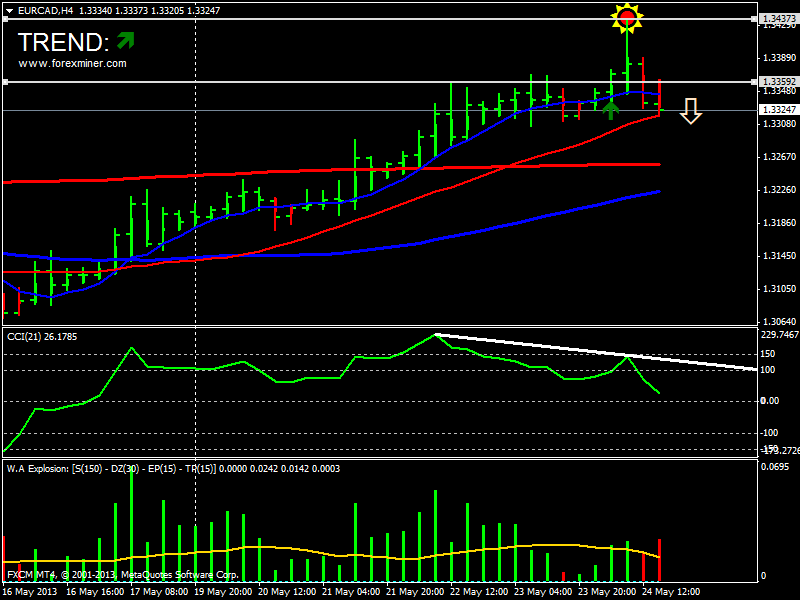
In this chart we can see we have confirmation of a sell..with the trend....
Yellow star an excellent divergence tool.
CCI has divergence.
WA Explosion confirms red bar above the yellow line.
Looking for price to pull back to 13350, with 100 pip stop.
Subscribe to:
Posts (Atom)